Tennis analytics: why the serve dominates the modern game
The serve has always been a powerful weapon in tennis, but in the past decade its influence has transformed from a tactical advantage into a game-defining force. Advances in data collection, statistical modeling, and on-court coaching have elevated serving from raw power to precision science. This article explores how analytics reveal the serve’s disproportionate role in match outcomes, why surface and style matter, and what the modern player — and fan — can learn from serve-focused metrics.
From intuition to numbers: the rise of tennis analytics
Tennis analysts, coaches, and players now have access to unprecedented data: ball-tracking systems, high-frame-rate video, and point-by-point logs that capture every serve speed, placement, spin, and resulting rally length. Where once commentators relied on subjective impressions, we can now quantify how often a serve earns a free point, how frequently it sets up a short rally, and how it changes opponent behavior over the course of a match.
Early metrics such as aces and double faults were useful but coarse. Modern analytics look deeper: first-serve percentage combined with win rate on first serve, second-serve return points won, and sequence-based models that evaluate how a serve affects the next three shots in a point. This shift has made the serve one of the most measurable and strategically understandable parts of the game.
Key serve metrics and what they reveal
When evaluating the serve’s impact, several statistics rise to the top. They reveal not just raw power but consistency, placement, and psychological pressure. Here are the core metrics that tennis analysts use to quantify serve performance.
First-serve percentage and first-serve points won
First-serve percentage tells us how often a player gets their preferred serve into play. First-serve points won measures the effectiveness of those serves when they land. A high first-serve percentage paired with a high win rate on those points is the gold standard — it combines safety and potency.
Players who can reliably land big first serves force opponents into defensive positions time and again. Analytics show that matches where a player holds a substantial edge in first-serve points won often end in straight sets because the opponent struggles to break momentum built around that serve.
Return points won and second-serve vulnerability
Return points won (often expressed as return games won or return points won percentage) is the natural counter-metric to serving. It measures how often a returner converts opportunities to neutralize or break serve. High return points won signals the ability to pressure serves, especially second serves.
Second-serve performance is critical because most breaks come on second-serve points. A player with a weak second serve — either low spin, predictable placement, or slow pace — will see a disproportionate number of return points won against them. Modern analytics isolate return points won specifically on the opponent’s second serve to highlight this vulnerability.
Ace leaders and service winners
Aces remain the clearest demonstration of serve dominance: an unreturned serve ends the point without rally. Tracking ace leaders, especially year-to-date lists like ace leaders 2024, gives an immediate sense of who’s using pure serve power successfully.
But aces tell only part of the story. Service winners, a broader category, include unreturned serves and serves that lead directly to a forced error. Service winners combined with low return points won against a player indicate a serve that not only produces aces but also consistently leads to short or successful points.
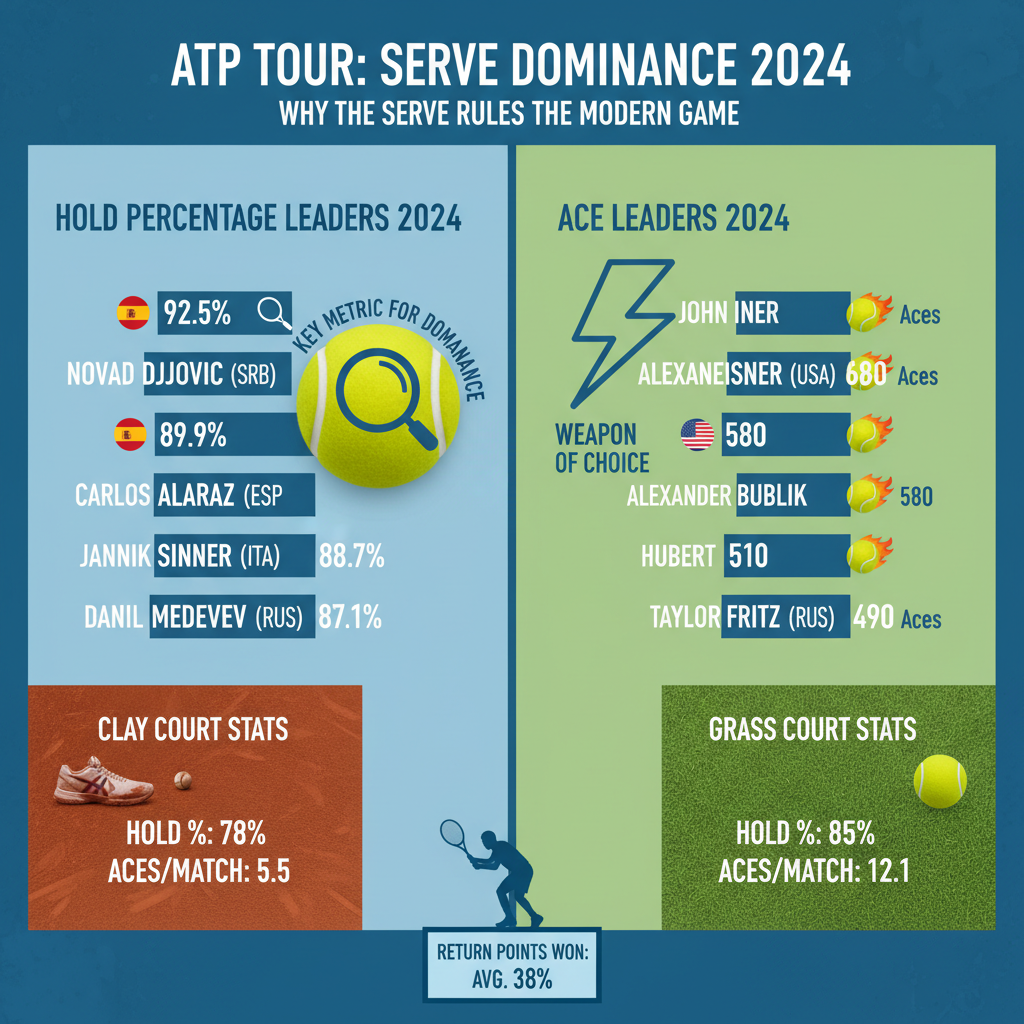
Hold percentage leaders and match control
Hold percentage measures how often players win their service games. It is a fundamental indicator of match control. Players who lead the tour on hold percentage are harder to break and therefore can afford more risk-taking on return games, altering the strategic flow of matches.
Analytics often combine hold percentage with break point conversion and break point saved metrics to describe a player’s service-game resilience. Being among hold percentage leaders is particularly valuable in formats like best-of-five where service holds compound into decisive set leads.
How the serve shapes point construction and match dynamics
A dominant serve does more than win direct points — it structures the entire point and match. The statistical influence of the serve shows up in rally length, shot selection, court positioning, and psychological pressure. Below are several mechanics by which the serve reshapes play.
Short points and energy conservation
Players with a powerful and efficient serve shorten points. Shorter average rally lengths mean less physical wear over long tournaments, allowing big servers to preserve energy and increase consistency deep into events. Analytics show correlations between shorter average rally length and higher match-win probabilities, especially for older or physically taxed players.
This energy conservation can be especially visible in Grand Slams, where five-set matches are common. A server who wins 70–80 percent of service points can rely on shorter matches to overcome return specialists who might otherwise grind them down in longer exchanges.
Pressure and the psychology of serve dominance
Reliably dominant serving creates strategic and mental pressure on the opponent. Knowing that you must earn a break on every service game changes shot selection: returners become more aggressive, risk more down-the-line returns, or try to jam the server with early aggression. These altered behaviors are measurable — we can see increased return errors and lower success on conservative returns under pressure.
Tennis match analysis that includes sequence modeling shows how serve dominance increases the variance opponents tolerate. A few successful aces or service winners early in a match can tilt the opponent’s confidence, leading to more unforced errors on return games and a higher likelihood of match momentum shifting away from them.
Surface matters: grass vs clay court stats and serve effectiveness
Surface type changes the serve’s effectiveness dramatically. Grass courts reward slice, low-bounce serves and raw speed, while clay slows the ball and rewards kick and consistency. Comparing grass vs clay court stats highlights why certain players succeed by leaning heavily on serve-based strategies on one surface but struggle on another.
Grass: acceleration of serve advantage
Grass courts exaggerate the serve’s strengths. Low, skidding bounces reduce reaction time for returners and make slice and flat serves particularly hard to neutralize. Serve statistics ATP on grass often show elevated ace rates, higher hold percentages, and shorter point lengths than on other surfaces.
Look at Wimbledon trends and you’ll see service-dominant performers rise: big servers frequently progress deep into the draw because their game minimizes extended baseline exchanges. Analytics for grass tournaments show a consistent pattern of ace leaders 2024 and beyond clustering on grass events, reflecting the surface’s affinity for the serve.
Clay: return game resurgence
Clay courts dampen the serve’s raw power by increasing bounce and slowing pace, which provides returners more time to react and resets points more often into baseline exchanges. Clay-level serve statistics ATP typically show lower ace counts and reduced first-serve dominance, while return points won percentages are higher across the tour.
In clay-court matches, the importance shifts toward consistency, endurance, and point construction. Players who might rely on serve-and-volley tactics on grass must adapt to longer rallies and greater emphasis on constructing winners from the baseline. Statistical models of clay tournaments emphasize return games, break point conversion, and rally tolerance.
Hybrid styles and surface adaptability
Some players tailor their serving style by surface. They add more slice on grass, more kick on clay, and adjust serve placement to exploit the court geometry. Analytical profiles that break down serve performance by surface are invaluable for coaches planning tournament schedules and match strategies.
For example, a player who ranks among hold percentage leaders on grass but drops significantly on clay may elect to focus on surface-specific training or selective scheduling. The data allow players to understand where their serve will translate into match wins and where it will require secondary strengths to compensate.
Case studies: serve-driven players and how analytics explain their success
Exploring individual players’ data illustrates how serve metrics translate into outcomes. Below are profiles that show different ways the serve can carry a career or complement a broader game.
Big-torque servers: raw speed and direct points
Some athletes built their game around the thunderbolt serve — high speed, flat trajectory, and the ability to generate aces. Analytics capture this through ace leaders 2024 lists and average serve speeds, highlighting players who accumulate free points and dominate on fast courts.
These players often pair high ace tallies with strong hold percentages and short match times. The downside emerges on slower surfaces or against returners who excel at reading serve patterns; analytics will show diminished first-serve points won and increased break susceptibility in those contexts.
Precision servers: placement and patterns
Not all successful servers rely on speed. Some win by placement, spin, and intelligent serving patterns that open the court for the next shot. Analytics here emphasize first-serve points won by placement zones (wide, body, T), percentage of service games won to love or 15, and service winner distribution.
These players often perform consistently across surfaces because their approach focuses on reliability and court geometry rather than raw pace. Match analysis shows they win many free or semi-free points by creating awkward returns that lead to predictable follow-up winners.
All-court servers: balance and adaptability
Top-ranked players who feature among hold percentage leaders often exhibit a balanced serving profile. They produce a high first-serve percentage, opportunistic aces, and a defensible second serve with enough variation to avoid repeated pressure on return points won.
All-court servers might not appear on ace leaders lists, but their subtlety shows up in service game resilience metrics: break points saved, lowest opponent return points won, and high conversion rates on pressure serves. They make opponents earn every break and thus can control matches strategically.
Return analytics: the counterweight to serve dominance
While this article emphasizes the serve, the return remains the critical counterbalance. Modern return analytics dissect not just whether returns win points but how returners neutralize specific serve types and how their tactics vary by opponent, surface, and match situation.
Return points won by serve zone
High-resolution data allow analysts to track return points won based on where the serve lands. For instance, a player may win a disproportionate number of return points against serves targeted to the T but struggle against wide serves. This helps coaches design return positioning and split-step timing tailored to specific opponents.
Aggregating these numbers across a tournament produces patterns that predict match outcomes. If a player’s return points won against wide serves is below average, opponents will exploit that zone, and analysts will forecast a lower break conversion rate.
Sequence models: how returns change points
Sequence-based tennis match analysis models evaluate how the first few shots — serve, return, and first groundstroke — set the trajectory for a point. These models reveal that certain returns are disproportionately influential in forcing defensive play from servers.
For example, a deep, angled return that neutralizes a big serve often leads to a break point within three shots. Analysts use these models to prioritize which returns to practice under match-like pressure and to outline the specific returns that convert into actionable winning patterns.
Match strategy informed by serve analytics
Coaches and players increasingly use serve analytics to craft match plans. Knowing which serves produce the highest probability of winning a point against a specific opponent can change serving order, risk in tiebreaks, and even tournament selection.
Serving patterns and opponent-specific strategies
Detailed statistics enable serving patterns that exploit opponent weaknesses. If an opponent fumbles on kick serves out wide on the ad side, analytics suggest targeting that pattern at 30–40 percent higher frequency in critical games to raise the probability of break points.
When combined with return points won data and holding patterns, these recommendations become tactical playbooks: where to place first serves on crucial points, when to float a second serve to reduce errors, and how to sequence serve types across a match to prevent opponent adjustment.
Tiebreaks, final sets, and risk management
Tiebreaks and deciding sets are where serving decisions are magnified. Players with high hold percentage leaders profiles can adopt more aggressive serves in tiebreaks, recognizing that their first-serve points won provide a margin of safety. Conversely, players with weaker second serves may choose conservative serve placement to avoid double-faulting under pressure.
Match analysis shows that optimal risk levels in tiebreaks depend on opponent return stats and surface. Analytics that model expected points gained versus probability of error help decide whether to play it safe or gamble with a high-risk serve at 5–5 in a tiebreak. These nuanced choices increasingly determine match outcomes at elite levels.
Training changes driven by serve-focused data
Analytics have also changed how players practice serves. Rather than simple repetition, training now involves simulated pressure scenarios, tracking metrics like first-serve percentage under fatigue, and integrating biomechanical feedback to maintain consistency across tournament weeks.
Practice under pressure and situational drills
Coaches use data to construct drills that mimic high-pressure moments where holding serve is critical. For example, a server might practice five-point sequences beginning with a second-serve point to train recovery and reduce predictable patterns that opponents exploit.
These drills are quantified: coaches record first-serve percentage, return points won against simulated patterns, and subsequent rally outcomes to measure improvement. Over a season, these metrics often correlate with improvements in hold percentage leaders rankings.
Biomechanics and injury management
High-speed serves generate stress on the shoulder, elbow, and lower back. Analytics that merge serve statistics ATP with biomechanical loads help teams monitor injury risk. They can prescribe rest, modify service toss height, or adjust serving motion across a tournament to balance effectiveness and longevity.
Players with long careers often credit these analytics-informed load management approaches with extending their peak performance while preserving serve potency.
Broadcasting and fan engagement: making the serve understandable
Television and digital platforms have used serve analytics to create richer narratives for fans. Visualizations of serve patterns, probability meters for winning a service game, and in-match indicators of return points won help casual viewers appreciate the strategic depth behind a serve.
Real-time stats and viewer education
During broadcasts, displays of first-serve percentage, number of aces, and hold percentage leaders add context to what otherwise might look like a simple exchange. Fans can now see why a player is favored to hold at 40–0, informed by match-specific analytics rather than gut instinct.
These tools also create storylines around ace leaders 2024 and similar lists, giving viewers benchmarks to compare performances across tournaments and surfaces. Real-time analytics have made the serve’s dominance comprehensible and compelling to a wider audience.
Limitations and the counterargument: when the return still wins
Although the serve is dominant in many contexts, it is not invincible. Return specialists exist and thrive by exploiting second-serve weaknesses, improving anticipation, and using movement to neutralize first serves. Analytics reveal scenarios where return metrics trump serving power.
Returners who upset serving advantage
Players who consistently rank highly for return points won often upset big servers by converting break opportunities and pushing matches into longer exchanges. On clay or in slower indoor conditions, returners’ statistical strengths translate into match wins despite facing opponents with higher ace counts or serve speeds.
These return specialists illustrate that while the serve is influential, tennis remains a multifaceted sport where baseline consistency, point construction, and strategic variety can overcome pure serving prowess.
Context matters: form, fatigue, and environmental factors
Serve statistics ATP tell a story in aggregate, but match-to-match variation is large. A server who dominates in early rounds may falter under fatigue, in windy conditions, or after an injury. Tennis match analysis that integrates context — such as temperature, wind, and recent match load — better predicts when serve dominance will hold.
Analytics are necessary but not sufficient; they must be interpreted within the real-world variability of sport. Players and coaches know this, and the best use analytics as one input among many in decision-making.
Predictive models and the future of serve analytics
Advances in machine learning have enabled predictive models that forecast match outcomes based on serve and return metrics. These models are increasingly granular, incorporating shot-by-shot probabilities, opponent tendencies, and surface-specific adjustments.
Shot-level probability and in-match adjustment
Shot-level probability models estimate the chance of winning a point based on a serve’s speed, placement, and the opponent’s recent return performance. Coaches use these probabilities to suggest in-match adjustments, such as increasing slice serves during a certain segment of the match where the opponent’s return success has dipped.
Such models allow players to adapt on the fly, changing not just serve selection but broader match tactics to exploit transient weaknesses detected by algorithms.
Scheduling and tournament strategy
Longer-term predictive analytics influence scheduling and season planning. Players can select tournaments where serve metrics historically translate into better hold percentage leaders outcomes or where their playing style meshes with grass vs clay court stats. This strategic scheduling maximizes ranking points and career longevity.
Analytics also guide surface-specific training blocks, deciding when to prioritize serve velocity gains versus spin control and when to emphasize return drills depending on upcoming calendar stretches.
Personal perspective: coaching and player experience
As a writer who has observed player training and served on advisory projects with coaches, I’ve seen how serve analytics change behavior. Teams now track small improvements — a few percentage points in first-serve percentage under pressure, a slight increase in return points won against second serves — and celebrate these as match-winning gains.
One anecdote comes to mind: a mid-level pro we tracked was averaging 62 percent first-serve in practice but fell to 54 percent in matches. By integrating pressure-simulated practice and monitoring serve location heat maps, his match first-serve percentage rose to 59 percent over a season, moving him from early exits to consistent deep runs at ATP 250 events. That marginal gain, informed by data, translated into tangible career progress.
Practical takeaways for players, coaches, and fans
Understanding why the serve dominates the modern game is useful no matter your role in tennis. For players and coaches, prioritizing serve consistency, second-serve resilience, and surface-specific adjustments are immediate action items. Fans can enjoy a richer appreciation of match flow and the subtle battle between serve and return.
- Players: Track and train first-serve percentage under match-like pressure and focus on making your second serve less predictable.
- Coaches: Use return points won breakdowns by serve zone to craft opponent-specific return positioning and serving patterns.
- Fans: Watch for hold percentage and ace leaders to identify likely match controllers, and note how surface changes can flip dynamics.
Data sources and how to follow the numbers
Accurate serve analysis depends on reliable data. Official tour sources, high-frequency ball-tracking systems, and detailed match logs provide the backbone for most tennis analytics. Following up-to-date leaderboards (such as ace leaders 2024 lists and hold percentage leaders tables) and consulting surface-specific breakdowns (grass vs clay court stats) will keep you informed about shifting trends.
Many broadcasters and analytics platforms now publish match-level data in near real time. For those interested in deeper dives, open datasets allow enthusiasts to build their own tennis match analysis models and test hypotheses about serve effectiveness, return points won, and momentum shifts.
Where the serve goes next
The serve’s role will continue to evolve as equipment, training, and analytics progress. We can expect more nuanced serve strategies, tailored biomechanical coaching to sustain power safely, and even more sophisticated models that anticipate opponent adjustments within matches. The interplay between serve and return will remain the central narrative of professional tennis.
Understanding serve statistics ATP, analyzing hold percentage leaders, watching ace leaders 2024 trends, and comparing grass vs clay court stats are all pathways to appreciating how the serve dominates. Yet the sport keeps providing exceptions — return specialists and tactical innovators who remind us that tennis remains a duel of many dimensions, and that the smartest use of data is to enhance intuition, not replace it.
In the end, the serve’s statistical supremacy teaches a broader lesson: marginal gains add up. A few percentage points on first serve, a minor improvement in return points won, or a slight surface-specific tweak can transform rounds into titles. That is why coaches, players, and fans alike now watch every serve with new curiosity and respect.